The elements of the set {x : x is an integer, x2 : 4} can be represent as .....Z..... . Here, Z refers to
A
{–2, 2}
B
{–1, 0, 1}
C
{–2, –1, 0, 1, 2}
D
{0, 1, 2}
Question 2Single Answer
A
B
C
D
None of these
Question 3Single Answer
If Y = {x : x is a positive factor of the number 2p – 1(2p – 1), where 2p – 1 is a prime number}, then Y can be represent in roster form as
A
{2}
B
{1, 2}
C
{1, 2, 22, ....., 2p – 1}
D
{1, 2, 22, 23,.... 2p – 1, (2p – 1)}
Question 4Single Answer
The set {x : x is a positive integer less than 6 and 3x – 1 is an even number} in roster form is
A
{1, 2, 3, 4, 5}
B
{1, 2, 3, 4, 5, 6}
C
{2, 4, 6}
D
{1, 3, 5}
Question 5Single Answer
If A B and A B, then
A
A is called a proper subset of B
B
A is called a super set of B
C
A is not a subset of B
D
B is a subset of A
Question 6Single Answer
The number of non-empty subsets of the set{1, 2, 3, 4} is
A
15
B
14
C
16
D
17
Question 7Single Answer
The number of elements of the power set of a set containing m elements is
A
2m – 1
B
m
C
m2
D
2m
Question 8Single Answer
If A = {x : x = n2, n = 1, 2, 3}, then number of proper subsets is
A
3
B
8
C
7
D
None of these
Question 9Single Answer
If A = {x : x = 4n + 1, 2 £ n £ 5},then number of subsets of A is
A
16
B
15
C
4
D
None of these
Question 10Single Answer
Let A and B be two non-empty subsets of a set X such that A is not a subset of B, then
A
A is always a subset of the complement of B
B
B is always a subset of A
C
A and B are always disjoint
D
A and the complement of B are always non-disjoint
Question 11Single Answer
Which of the following is/are empty set?
A = {x : x2 + x + 1 = 0 and x Î Z} B = {x : x is a prime number and 19 < x < 23}
A
A
B
B
C
Both A and B
D
None of the above
Question 12Single Answer
The set {x : x4 = 1 and x R} is .....X.... set. Here, X refers to
A
empty
B
finite
C
infinite
D
singleton
Question 13Single Answer
The universal set for the sets
A = {x : x2 – 5x + 6 = 0} and
B = {x : x2 – 3x + 2 = 0} having least number of elements is
A
{1, 2}
B
{1, 3}
C
{1, 2, 3}
D
{0, 1, 2, 3}
Question 14Single Answer
If A = {1, 2, 3}, B = {x € R : x2 – 2x + 1 = 0},
C = {1, 2, 2, 3} and
D = {x € R : x3 – 6x2 + 11x – 6 = 0}, then the equal sets are
A
A and B
B
A and C
C
A, B and C
D
A, C and D
Question 15Single Answer
If A = (–3, 5) and B = [–7, 9], then
A
A = B
B
A B
C
B A
D
None of these
Question 16Single Answer
Two finite sets have m and n elements, respectively. The total number of subsets of first set is 56 more than the total number of subsets of the second set. The value of m and n respectively are
A
7, 6
B
5, 1
C
6, 3
D
8, 7
Question 17Single Answer
Combine terms: 12a + 26b - 4b – 16a .
A
4a + 22b
B
-28a + 30b
C
-4a + 22b
D
28a + 30b
Question 18Single Answer
The average of first 50 natural numbers is ………… .
A
25.30
B
25.5
C
25.00
D
12.25
Question 19Single Answer
60 Times of 8 Equals to
A
480
B
300
C
250
D
400
Question 20Single Answer
Consider the sets
A = {x : x is a real number and x2 + 1 = 0}
B = {x : x is a real number and x2 – 16 = 0}
C = {x : x is a real number and x2 = x + 2}
Which of the following is are null set ?
A
A
B
A and B
C
A and C
D
A, B and C
Question 21Single Answer
If X = {4n – 3n – 1: n Î N} and Y = {9(n – 1): n Î N}; where N is the set of natural numbers, then X È Y is equal to
A
N
B
Y – X
C
X
D
Y
Question 22Single Answer
Which of the following is / are correct?
I. {2, 3, 4} {1, 2, 3, 4, 5}
II. {a, b, c} {b, c, d}
III. {x : x is an equilateral triangle in a plane} Ì {x : x is a triangle in the same plane}
IV. {x : x is an even natural number} {x : x is an integer}
A
I and III are correct
B
II and III are correct
C
Only IV is correct
D
All above are correct
Question 23Single Answer
A
B
C
D
Question 24Single Answer
Consider the following statements :
1. The set of all irrational numbers between √2 and √5 is an infinite set .
2. The set of all odd integers less than 100 is a finite set .
Which of the statements given above is/are correct ?
A
1 only
B
2 only
C
Both 1 and 2
D
Neither 1 nor 2
Question 25Single Answer
What is the Next Prime Number after 7 ?
A
13
B
12
C
14
D
11
Question 26Single Answer
If A and B are two given sets, then A (A B)C is equal to
A
A
B
B
C
D
Question 27Single Answer
121 Divided by 11 is
A
11
B
10
C
19
D
18
Question 28Single Answer
Let X be the universal set for sets A and B, if n(A) = 200, n(B) = 300 and n = 100, then n is equal to 300 provided n(X) is equal to
A
600
B
700
C
800
D
900
Question 29Single Answer
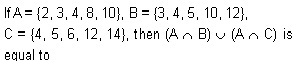
A
{3, 4, 10}
B
{2, 8, 10}
C
{4, 5, 6}
D
{3, 5, 14}
Question 30Single Answer
Let A = {x : x is a prime factor of 240} B = {x : x is the sum of any two prime factors of 240}, then
A
B
C
D
Question 31Single Answer
If A = {x : x is a multiple of 4 and x N} and B = {x : x is a multiple of 6 and x N}, then A B consists of all multiples of
A
16
B
12
C
8
D
4
Question 32Single Answer
A
A = B
B
B = C
C
A = C
D
None of these
Question 33Single Answer
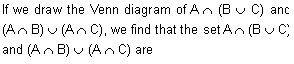
A
equal
B
disjoint
C
either equal or disjoint
D
none of the above
Question 34Single Answer
A
{–i, i}
B
{–1, 1}
C
{–1, 1, i, –i}
D
None of these
Question 35Single Answer
If A = {x : f(x)= 0} and
B = {x : g(x) = 0}, then A B will be
A
[f(x)]2 + [g(x)]2 = 0
B
C
D
None of the above
Question 36Single Answer
In a college part girls and part boys attended a social camp. How many parts in the collegs students attended the camp ?
A
B
C
D
E
None of the above
Question 37Single Answer
The sum of two number is 16 and their difference is 2. What is the product to both numbers ?
A
35
B
56
C
56
D
72
Question 38Single Answer
What are the positive factors of 160 .
A
6
B
8
C
5
D
12
Question 39Single Answer
What is the value of (51 + 52 + 53 ........100) ?
A
1325
B
5050
C
3775
D
3325
Question 40Single Answer
What is the sum of all natural numbers that come in the between 1 to 100, which a multiple of 7 ?
A
735
B
745
C
675
D
705
Question 41Single Answer
What is the unit digit of 279 + 167 × 342 ?
A
1
B
3
C
5
D
8
Question 42Single Answer
Which of the given values is completely divisible by 15 ?
A
2365
B
1375
C
4365
D
2275
Question 43Single Answer
For which value of M, the divisor 34M fully divisible by 12 ?
A
2
B
0
C
8
D
6
Question 44Single Answer
If 432p1 is completely divisiable 34M fully divisiable by 12 ?
A
1
B
8
C
7
D
2
Question 45Single Answer
Which is the smallest number to be added to 100, so that the resulting number is completely divisible by 6 ?
A
2
B
3
C
5
D
4
Question 46Single Answer
When a number is divided by 80, the remainded is 20. When the same number is divided by 16, what will be the remainder ?
A
2
B
4
C
6
D
8
Question 47Single Answer
Which of the fractions is the largest among and ?
A
B
C
D
All are equal
Question 48Single Answer
What is the two digits largest prime number ?
A
91
B
93
C
97
D
99
Question 49Single Answer
What is the sum of first 15 odd natural numbers ?
A
255
B
225
C
235
D
215
Question 50Single Answer
What will be the sum of all natural numbers from 75 to 97 ?
A
1598
B
1978
C
1798
D
1958
Important Questions Package
OSSC Vital Statistics Assistant Exam Online Question Bank Package
Buy OSSC Vital Statistics Assistant Important Questions, MCQ, question answer in Hindi & English. It will help you to score high marks in OSSC Vital Statistics Assistant question bank 2026 in Online, PDF & Print study material.
+ Free Monthly Current Affairs, GK & more PDF Download
Sr.
Package Name
Amount
1.
OSSC Vital Statistics Assistant Prelims Exam - English
Description : 1000 Question with Answer
₹101[₹500]
2.
OSSC Vital Statistics Assistant Prelims Exam - English
Description : 2000 Question with Answer
₹151[₹500]
3.
OSSC Vital Statistics Assistant Mains Exam - English
Description : 1000 Question with answer
₹101[₹500]
4.
OSSC Vital Statistics Assistant Mains Exam - English
Description : 2000 Question with Answer
₹151[₹500]
5.
OSSC Vital Statistics Assistant Prelims Exam - English
Description : 1000 Question & Answer Download in PDF (Send by Email)
₹151[₹450]
6.
OSSC Vital Statistics Assistant Mains Exam - English
Description : 1000 Question & Answer Download in PDF (Send by Email)
₹151[₹450]
7.
OSSC Vital Statistics Assistant Prelims Exam Question Bank Book - English
Description : 1000 Question with Answer (Printed Material)
₹390[₹600]
8.
OSSC Vital Statistics Assistant Mains Exam Question Bank Book - English
Description : 1000 Question with Answer (Printed Material)
₹390[₹600]
Statistics
Question 51Single Answer
Which of the following statement is true?
A
statistics is derived from the French word ‘Statistik’
B
statistics is derived from the Latin word ‘Status’
C
statistics is derived from the Italian word ‘Statista’
D
none of these
Question 52Single Answer
Statistics is concerned with _____
A
qualitative information
B
quantitative information
C
either (a) or (b)
D
both (a) and (b)
Question 53Single Answer
Statistics is defined in terms of numerical data in the _____
A
singular sense
B
plural sense
C
either or (b)
D
both (a) and (b)
Question 54Single Answer
Drinking habit of a person is _____
A
an attribute
B
a discrete variable
C
a variable
D
a continuous variable
Question 55Single Answer
Marks of a student is an example of _____
A
a continuous variable
B
a discrete variable
C
an attribute
D
none of these
Question 56Single Answer
Annual income of a person is _____
A
a continuous variable
B
a discrete variable
C
an attribute
D
(b) or (c)
Question 57Single Answer
An attribute is _____
A
a qualitative characteristic
B
a measurable characteristic
C
a quantitative characteristic
D
all these
Question 58Single Answer
Nationality of a student is ____
A
an attribute
B
a discrete variable
C
a continuous variable
D
either (a) or (C)
Question 59Single Answer
The most attractive method of data presentation is ____
A
diagrammatic
B
textual
C
tabular
D
either (a) or (b)
Question 60Single Answer
In tabulation source of the data, if any, is shown in the ____
A
footnote
B
body
C
stub
D
caption
Question 61Single Answer
The mode of presentation of data are ____
A
textual, tabulation and diagrammatic
B
tabular, internal and external
C
textual, tabular and internal
D
tabular, textual and external
Question 62Single Answer
The most accurate mode of data presentation is _____
A
diagrammatic method
B
tabulation
C
textual presentation
D
none of these
Question 63Single Answer
The best method of presentation of data is ____
A
textual
B
tabular
C
diagrammatic
D
both (b) and (c)
Question 64Single Answer
Details are shown by ____
A
charts
B
tabular presentation
C
both (a) and (b)
D
none of these
Question 65Single Answer
The unit of measurement in tabulation is ____
A
box head
B
body
C
caption
D
stub
Question 66Single Answer
In general the number of types of tabulation are ____
A
two
B
three
C
one
D
four
Question 67Single Answer
For tabulation, 'caption' is ____
A
the lower part of the table
B
the main part of the table
C
the upper part of the table
D
the upper part of a table that describes the column and sub-column
Question 68Single Answer
A table has ____
A
four parts
B
two parts
C
five parts
D
none of these
Question 69Single Answer
The entire upper part of a table is known as ____
A
caption
B
stub
C
box head
D
body
Question 70Single Answer
'Stub' of a table is the ____
A
right part of the table describing the columns
B
left part of the table describing the columns
C
right part of the table describing the rows
D
left part of the table describing the rows
Question 71Single Answer
Which of the following statements is not true for tabulation?
A
complicated data can be presented
B
it facilitates comparison between rows and not columns
C
statistical analysis of data requires tabulation
D
diagrammatic representation of data requires tabulation
Question 72Single Answer
Diagrammatic representation of data is done by ____
A
pictures
B
charts
C
diagrams
D
all these
Question 73Single Answer
The relationship between two variables are shown in ____
A
histogram
B
pictogram
C
bar diagram
D
line diagram
Question 74Single Answer
The data collected on the height of a group of students after recording their heights with a measuring tape are
A
primary data
B
continuous data
C
discrete data
D
secondary data
Question 75Single Answer
The quickest method to collect primary data is ____
A
personal interview
B
by observation
C
telephone interview
D
indirect interview
Question 76Single Answer
Some important sources of secondary data are ____
A
international and Government sources
B
private and primary sources
C
international and primary sources
D
government sources
Question 77Single Answer
Data collected on religion from the census reports are ___
A
(a) sample data
B
secondary data
C
primary data
D
either (a) or (b)
Question 78Single Answer
Which method of collection of data covers the widest area?
A
direct interview method
B
mailed questionnaire method
C
telephone interview method
D
all of these
Question 79Single Answer
In case of a rail accident, the appropriate method of data collection is by ____
A
direct interview
B
personal interview
C
indirect interview
D
all of these
Question 80Single Answer
The best method to collect data, in case of a natural calamity, is __
A
personal interview
B
questionnaire method
C
indirect interview
D
direct observation method
Question 81Single Answer
The number of observations falling within a class is called ___
A
density
B
frequency
C
both (a) and (b)
D
none of these
Question 82Single Answer
Classes with zero frequencies are called ____
A
class
B
empty class
C
nill class
D
none of these
Question 83Single Answer
Frequency distribution ____
A
arranges observations in an increasing order
B
arranges observations in terms of a number of groups
C
relates to a measurable characteristic
D
all of these
Question 84Single Answer
The number of "Frequency distribution" is ___
A
two
B
one
C
five
D
four
Question 85Single Answer
The Frequency distribution of a continuous variable is known as ___
A
grouped frequency distribution
B
simple frequency distribution
C
either (a) or (b)
D
both (a) and (b)
Question 86Single Answer
(Class frequency)/(Width of the class) is defined as ____
A
frequency density
B
frequency distribution
C
both (a) and (b)
D
none of these
Question 87Single Answer
The distribution of shares is an example of the frequency distribution of ____
A
a discrete variable
B
an attribute
C
a continuous variable
D
either (a) or (c)
Question 88Single Answer
Tally marks determines ____
A
class width
B
class boundary
C
class limit
D
class frequency
Question 89Single Answer
Mutually inclusive classification is usually meant for ____
A
a discrete variable
B
an attribute
C
a continuous variable
D
none of these
Question 90Single Answer
For determining the class frequencies it is necessary that these classes are _____
A
mutually exclusive
B
not mutually exclusive
C
independent
D
none of these
Question 91Single Answer
Mutually exclusive classification ____
A
excludes the upper class limit but includes the lower class limit
B
excludes both the class limits
C
includes the upper class limit but excludes the upper class limit
D
either (b) or (c)
Question 92Single Answer
Mutually exclusive classification is usually meant for ____
A
an attribute
B
a continuous variable
C
a discrete variable
D
any of these
Question 93Single Answer
The number of types of cumulative frequency is ____
A
one
B
three
C
two
D
four
Question 94Single Answer
The lower class boundary is ____
A
an upper limit to Lower Class Limit
B
a lower limit to Lower Class Limit
C
both (a) and (b)
D
none of these
Question 95Single Answer
Cumulative Frequency Distribution is ____
A
frequency
B
graph
C
statistical table
D
distribution
Question 96Single Answer
Graph is a ____
A
line diagram
B
bar diagram
C
pie diagram
D
pictogram
Question 97Single Answer
The chart that uses logarithm of the variable is known as ___
A
multiple line chart
B
ratio chart
C
line chart
D
component line chart
Question 98Single Answer
Horizontal bar diagram is used for ____
A
data varying over space
B
data varying over time
C
qualitative data
D
either (a) or (C)
Question 99Single Answer
Multiple axis line chart is considered when ____
A
the units of the variables are different
B
there is more than one time series
C
both (a) and (b)
D
either (a) or (b)
Question 100Single Answer
Divided bar chart is considered for ____
A
the relation of different components to the table
B
comparing different components of a variable
C
either (a) or (b)
D
both (a) and (b)
Question 101Single Answer
Vertical bar diagram is applicable when ____
A
the data are qualitative
B
the data are quantitative
C
when the data vary over time
D
either (a) or (c)
Question 102Single Answer
In order to compare two or more related series, we consider ____
A
grouped bar chart
B
multiple bar chart
C
either (a) or (b)
D
both (a) and (b)
Question 103Single Answer
Multiple line chart is applied for ____
A
showing multiple charts
B
two or more related time series when the variables are expressed in the same unit
C
multiple variations in the time series
D
two or more related time series when the variables are expressed in different units
Question 104Single Answer
An area diagram is _____
A
histogram
B
ogive
C
frequency Polygon
D
none of these
Question 105Single Answer
An approximate idea of the shape of frequency curve is given by ____
A
ogive
B
frequency Polygon
C
both (a) and (b)
D
none of these
Question 106Single Answer
The graphical representation of a cumulative frequency distribution is called _____
A
histogram
B
ogive
C
both (a) and (b)
D
none of these
Question 107Single Answer
When all classes have a common width, then we use ____
A
pie chart
B
frequency polygon
C
both (a) and (b)
D
none of these
Question 108Single Answer
Ogive is a _____
A
line diagram
B
bar diagram
C
both (a) and (b)
D
none of these
Question 109Single Answer
The most common form of diagrammatic representation of a grouped frequency distribution is _____
A
ogive
B
histogram
C
frequency Polygon
D
none of these
Question 110Single Answer
To find the number of observations less than any given value we use ____
A
grouped frequency distribution
B
single frequency distribution
C
cumulative frequency distribution
D
none of these
Question 111Single Answer
Unequal widths of classes in the frequency distribution do not cause any difficulty in the construction of ____
A
ogive
B
histogram
C
frequency polygon
D
none of these
Question 112Single Answer
Vertical bar chart may appear somewhat alike ____
A
histogram
B
frequency Polygon
C
both (a) and (b)
D
none of these
Question 113Single Answer
A representative value of the class interval for the calculation of mean, standard deviation, mean deviation, etc., is ____
A
class limit
B
class interval
C
class mark
D
none of these
Question 114Single Answer
Most extreme values which would ever be included in a class interval are called ____
A
class interval
B
class limits
C
class boundaries
D
none of these
Question 115Single Answer
Difference between the lower and upper class boundaries is ____
A
size
B
width
C
both (a) and (b)
D
none of these
Question 116Single Answer
"Cumulative Frequency" only refers to the ____
A
less-than type
B
more-than type
C
both (a) and (b)
D
none of these
Question 117Single Answer
Length of a class is ____
A
the difference between the U.C.B. and L.C.B. of the class
B
the difference between the U.C.L. and L.C.L. of that class
C
either (a) or (b)
D
both (a) and (b)
Question 118Single Answer
The value exactly at the middle of a class interval is called ___
A
class mark
B
mid-value
C
both (a) and (b)
D
none of these
Question 119Single Answer
For a particular class boundary, the less than cumulative frequency add up to ____
A
total frequency
B
fifty per cent of the total frequency
C
either (a) or (b)
D
none of these
Question 120Single Answer
Frequency density is used in the construction of ____
A
histogram
B
frequency Polygon
C
ogive
D
none of these
Question 121Single Answer
Relative frequency for a particular class _____
A
lies between 0 and 1
B
lies between - 1 and 0
C
lies between 0 and 1, both inclusive
D
lies between - 1 to 1
Question 122Single Answer
In the construction of a frequency distribution, it is generally ___ preferable to have classes of
A
equal width
B
unequal width
C
maximum width
D
none of these
Question 123Single Answer
Upper limit of any class is _____
A
same
B
different
C
both (a) and (b)
D
none of these
Question 124Single Answer
For the construction of a grouped frequency distribution, we take ___
A
class boundaries
B
class limits
C
both (a) and (b)
D
none of these
Question 125Single Answer
Frequency density corresponding to a class interval is the ratio of _____
A
class length to the total frequency
B
class frequency to the class length
C
class frequency to the total frequency
D
class frequency to the cumulative frequency
Question 126Single Answer
Class boundaries should be considered to be the real limits for the class interval ____
A
true
B
false
C
both (a) and (b)
D
none of these
Question 127Single Answer
Upper boundary of any class coincides with the Lower boundary of the next class ____
A
true
B
false
C
both (a) and (b)
D
none of these
Question 128Single Answer
For the construction of grouped frequency distribution from ungrouped data, one requires ____
A
class limits
B
class boundaries
C
class width
D
none of these
Question 129Single Answer
Excepting the first and the last, all other class boundaries lie mid-way between the upper limit of a class and the lower limit of the next higher class ____
A
true
B
false
C
both (a) and (b)
D
none of these
Question 130Single Answer
When one end of a class is not specified, the class is called ____
A
closed-end class
B
open-end class
C
both (a) and (b)
D
none of these
Question 131Single Answer
If x and y are related by x – y – 10 = 0 and mode of x is known to be 23, then the mode of y is :
A
20
B
13
C
3
D
23
Question 132Single Answer
A man travels at a speed of 20 km/hr and then returns at a speed of 30 km/hr. His average speed of the whole journey is
A
25 km/hr
B
24.5 km/hr
C
24 km/hr
D
None
Question 133Single Answer
A student obtained the mean and standard deviation of 100 observations as 40 and 5.1 respectively. It was later discovered that he had wrongly copied down an observation as 50 instead of 40. The correct standard deviation is
A
5
B
6
C
3
D
7
Question 134Single Answer
For a moderately skewed distribution, quartile deviation and the standard deviation are related by
A
B
C
D
Question 135Single Answer
The median of the data 13, 8, 11, 6, 4, 15, 2, 18 is
A
5
B
8
C
11
D
9.5
Question 136Single Answer
The sum of the squares of deviations of a set of observations has the smallest value; when the deviations are taken from their
A
A.M.
B
H. M.
C
G. M.
D
None
Question 137Single Answer
If two samples of sizes 30 and 20 have means as 55 and 60 and variances as 16 and 25 respectively, then what would be the S.D. of the combined sample size 50 ?
A
5.33
B
5.17
C
5.06
D
5
Question 138Single Answer
If two variables x & y are related by 2x + 3y –7 = 0 and the mean and mean deviation about mean of x are 1 and 0.3 respectively, then the coefficient of mean deviation of y about mean is
A
–5
B
4
C
12
D
50
Question 139Single Answer
Which of the following result hold for a set of distinct positive observations ?
A
A.M > G.M > H.M
B
G.M. > A.M. > H.M
C
G.M > A.M > H.M
D
A.M > G.M > H.M
Question 140Single Answer
Measures of dispersion are called averages of the ____ order .
A
1st
B
2nd
C
3rd
D
None
Question 141Single Answer
For a set of 100 observations, taking assumed mean as 4, the sum of the deviations is –11 cm and the sum of the squares of these deviations is 257 cm. The coefficient of variation is :
A
41.13%
B
42.13%
C
0.13%
D
None
Question 142Single Answer
If the AM and HM for two numbers are 5 and 3.2 respectively, then the GM will be
A
4.05
B
16
C
4
D
4.10
Question 143Single Answer
________ are used for measuring central tendency, dispersion and skewness
A
Median
B
Deciles
C
Percentiles
D
Quartiles
Question 144Single Answer
Which of the following companies A or B is more consistent so far as the payment of dividend is concerned ?
Dividend paid by A : 5 9 6 12 15 10 8 10
Dividend paid by B : 4 8 7 15 18 9 6 6
A
A
B
B
C
Both A & B
D
Neither A nor B
Question 145Single Answer
What is the coefficient of range for the following distribution ?
Class Interval : 10-19 20-29 30-39 40-49 50-59
Frequency : 11 25 16 7 3
A
22
B
50
C
75.82
D
72.46
Question 146Single Answer
An aeroplane flies from A to B at the rate of 500 km/hr and comes back from B to A at the rate of 700 km/hr. The average speed of the aeroplane is
A
600 km/hr
B
583.33 km/hr
C
D
620 km/hr
Question 147Single Answer
For a moderately skewed distribution, which of the following relationship holds ?
A
Mean – Median = 3 (Median – Mode)
B
Median – Mode = 3 (Mean – Median)
C
Mean – Mode = 3 (Mean – Median)
D
Mean – Median = 3 (Mean – Mode)
Question 148Single Answer
___ & ___ are called ratio averages :
A
HM & GM
B
HM & AM
C
AM & GM
D
None
Question 149Single Answer
A sample of 35 observations has the mean 80 and S.D. as 4. A second sample of 65 observations from the same population has mean 70 and S.D. 3. The S.D. of the combined sample is :
A
5.85
B
5.58
C
10.23
D
None of these
Question 150Single Answer
If x and y are related as 3x – 4y = 20 and the quartile deviation of x is 12, then the quartile deviation of y is
A
14
B
15
C
16
D
9
Question 151Single Answer
Extreme values have ____ effect on mode .
A
High
B
low
C
No
D
None of these
Question 152Single Answer
The mean salary for a group of 40 female workers is Rs. 5,200 per month and that for a group of 60 male workers is Rs. 6,800 per month. What is the combined salary ?
A
Rs. 6,160
B
Rs. 6,280
C
Rs. 6,890
D
Rs. 6,920
Question 153Single Answer
The best measure of dispersion is
A
Q.D.
B
M.D.
C
Range
D
S.D.
Question 154Single Answer
If the mean and S.D. of x are a and b respectively, then the S.D. of is :
A
a/b
B
–1
C
1
D
ab
Question 155Single Answer
Suppose a population A has 100 observations 101, 102, 103, ...., 200 and another population B has 100 observations 151, 152, 153, ....., 250. If VA and VB represents the variance of the two populations respectively, then VA/ VB =
A
9/4
B
1
C
4/9
D
2/3
Question 156Single Answer
If there are two groups with 75 and 65 as harmonic means and containing 15 and 13 observations then the combined H.M. is given by :
A
70
B
80
C
70.35
D
69.48
Question 157Single Answer
The G.M. of 4, 6 and 8 is
A
4.17
B
5.32
C
6.14
D
5.77
Question 158Single Answer
The Mean and S.D. for group of 100 observations are 65 and 7.03 respectively. If 60 of these observations have mean and S.D. as 70 and 3 respectively, what is the S.D. for the group comprising 40 observations ?
A
2.03
B
4.03
C
8.03
D
9.33
Question 159Single Answer
The Quartile deviation for the date is
x : 2 3 4 5 6
y : 3 4 8 4 1
A
1/4
B
1/2
C
1
D
0
Question 160Single Answer
If X and Y are two random variables then v(x + y) is
A
v(x) + v(y)
B
v(x) + v(y) – 2v(x, y)
C
v(x) + v(y) + 2v(x, y)
D
v(x) – v(y)
Question 161Single Answer
G.M is a better measure than others when,
A
ratios and percentages are given
B
interval of scale is given
C
Both (a) and (b)
D
Either (a) or (b)
Question 162Single Answer
Mean and S.D. of x is 50 and 5 respectively. Find mean and S.D. of .
A
(1, 0)
B
(0, 1)
C
(1, 1)
D
(0, –1)
Question 163Single Answer
Mean and S.D. of a given set of observations is 1,500 and 400 respectively. If there is an increment of 100 in the first year and each observation is hiked by 20% in 2nd years, then find new mean and S.D.
A
1920, 480
B
1920, 580
C
1600, 480
D
1600, 400
Question 164Single Answer
If 5 is subtracted from each observation of some certain item then its coefficient of variation is 10% and if 5 is added to each item then its, coefficient of variation is 6%. Find original coefficient of variation
A
8 %
B
7.5 %
C
4 %
D
None of these
Question 165Single Answer
The median of x, is 10. Find x where x > 0 .
A
24
B
32
C
8
D
16
Question 166Single Answer
The average salary of 50 men was Rs. 80 but it was found that salary of 2 of them were Rs. 46 and Rs. 28 which was wrongly taken as Rs. 64 and Rs. 82. The revised average salary is :
A
Rs. 80
B
Rs. 78.56
C
Rs. 85.26
D
Rs. 82.92
Question 167Single Answer
Inter Quartile Range is _____ of Quartile Deviation .
A
Half
B
Double
C
Triple
D
Equal
Question 168Single Answer
The sum of squares of deviation from mean of 10 observations is 250. Mean of the data is 10. Find the coefficient of variation .
A
10 %
B
25 %
C
50 %
D
0 %
Question 169Single Answer
If A be the A.M. of two positive unequal quantities X and Y and G be their G.M., then ;
A
A < G
B
A > G
C
A < G
D
A > G
Question 170Single Answer
When mean is 3.57 and mode is 2.13 then the value of median is
A
3.09
B
5.01
C
4.01
D
None of these
Question 171Single Answer
If L1 = highest observation and L2 = smallest observation, then Coefficient of Range =
A
B
C
D
Question 172Single Answer
The equation of a line is 5x + 2y = 17, Mean deviation of y about mean is 5. Calculate mean deviation of x about mean .
A
–2
B
2
C
–4
D
None
Question 173Single Answer
If variance of x is 5, then find the variance of (2 – 3x)
A
10
B
15
C
5
D
– 13
Question 174Single Answer
The harmonic mean of 1, 1/2, 1/3 ... 1/n is
A
1 / (n + 1)
B
2 / (n + 1)
C
(n + 1) / 2
D
1 / (n – 1)
Question 175Single Answer
The mean weight of 15 students is 110 kg. The mean weight of 5 of them is 100 kg. and of another five students is 125 kg. then the mean weight of the remaining students is
A
120
B
105
C
115
D
None of these
Question 176Single Answer
In a class of 11 students, 3 students were failed in a test. 8 students who passed secured 10, 11, 20, 15, 12, 14, 26 and 24 marks respectively. What will be the median marks of the students
A
12
B
15
C
13
D
13.5
Question 177Single Answer
The variance of data : 3, 4, 5, 8 is
A
4.5
B
3.5
C
5.5
D
6.5
Question 178Single Answer
A lady travel at a speed of 20 km/h and returned at quicker speed. If her average speed of the whole journey is 24 km/h, find the speed of return journey (in km/h)
A
25
B
30
C
35
D
38
Question 179Single Answer
Let the mean of the variable 'x' be 50, then the mean of u = 10 + 5x will be
A
250
B
260
C
265
D
273
Question 180Single Answer
Given the observations 4, 9, 11, 14, 37. The Mean deviation about the Median is
A
11
B
8.5
C
7.6
D
7.45
Question 181Single Answer
β1 represents
A
Skewness
B
Kurtosis
C
Dispersionsx
D
All of the above
Question 182Single Answer
β2 represents
A
Skewness
B
Kurtosis
C
Dispersions
D
All of the above
Question 183Single Answer
γ1 is =
A
β2
B
β1
C
D
Question 184Single Answer
γ2 is =
A
β2 – 3
B
β2 + 3
C
both
D
none
Question 185Single Answer
β coefficients are suggested by
A
Karl Pearson
B
R.A. Fisher
C
Bowle
D
Kellis
Question 186Single Answer
γ coefficients are suggested by
A
Karl Pearson
B
R.A. Fisher
C
Bowle
D
Kellis
Question 187Single Answer
The curve is bell shaped or symmetric then skewness value is
A
zero
B
one
C
any positive value
D
any negative value
Question 188Single Answer
If β2 = 3 then the Kurtesis is
A
Leptokurtic
B
Platykurtic
C
Mesokurtic
D
Any of the above
Question 189Single Answer
If β2 < 3 then the Kurtesis is
A
Leptokurtic
B
Platykurtic
C
Mesokurtic
D
Any of the above
Question 190Single Answer
If β2 > 3 then the Kurtesis is
A
Leptokurtic
B
Platykurtic
C
Mesokurtic
D
Any of the above
Question 191Single Answer
If γ2 = 0 then the Kurtesis is
A
Leptokurtic
B
Platykurtic
C
Mesokurtic
D
Any of the above
Question 192Single Answer
If γ2 < 0 then the Kurtesis is
A
Leptokurtic
B
Platykurtic
C
Mesokurtic
D
Any of the above
Question 193Single Answer
The limits of the Karl Pearson Coefficient of Skewness .......
A
–1 to +1
B
–2 to +2
C
–3 to +3
D
–4 to +4
Question 194Single Answer
The limits of the Bowle's Coefficient of Skewness ........
A
–1 to +1
B
–2 to +2
C
–3 to +3
D
–4 to +4
Question 195Single Answer
For a positive skewed frequency curve, the inequality that holds is ?
A
Q1 + Q3 > 2Q2
B
Q1 + Q2 > 2Q3
C
Q1 + Q3 > 2Q3
D
Q3 + Q1 > 2Q2
Question 196Single Answer
For a negatively skewed frequency distribution curve, the third central moment,
A
µ3 > 0
B
µ3 < 0
C
µ3 = 0
D
µ3 does not exist
Question 197Single Answer
For a symmetrical distribution, the coefficient of skewness ?
A
α3 = 1
B
α3 = 3
C
α3 = 0
D
α3 = –1
Question 198Single Answer
For a leptokurtic frequency curve, the measure of Kurtosis ?
A
α4 = 0
B
α4 = – 3
C
α4 < 1
D
α4 > 3
Question 199Single Answer
In case of positive skewed distribution, the extreme values lie in the ?
A
left tail
B
right tail
C
middle
D
anywhere
Question 200Single Answer
The extreme values in a negatively skewed distribution lie in the ?






 B and A
 B, then
 R} is .....X.... set. Here, X refers to
 B
 A





 (A


 = 100, then n
 is equal to 300 provided n(X) is equal to


 N} and B = {x : x is a multiple of 6 and x
 N}, then A
 B consists of all multiples of


 B will be


 part girls and
 part boys attended a social camp. How many parts in the collegs students attended the camp ?


 and
 ?


 is :
 .
 is 10. Find x where x > 0 .


